
Every new Salesforce release gets the same test from me before I trust it: strip the price tag out of the conversation and ask what the business problem actually is, and whether the fix scales. Multi-Framework’s pitch was React, natively, on the platform. Fine - but React for what, exactly?
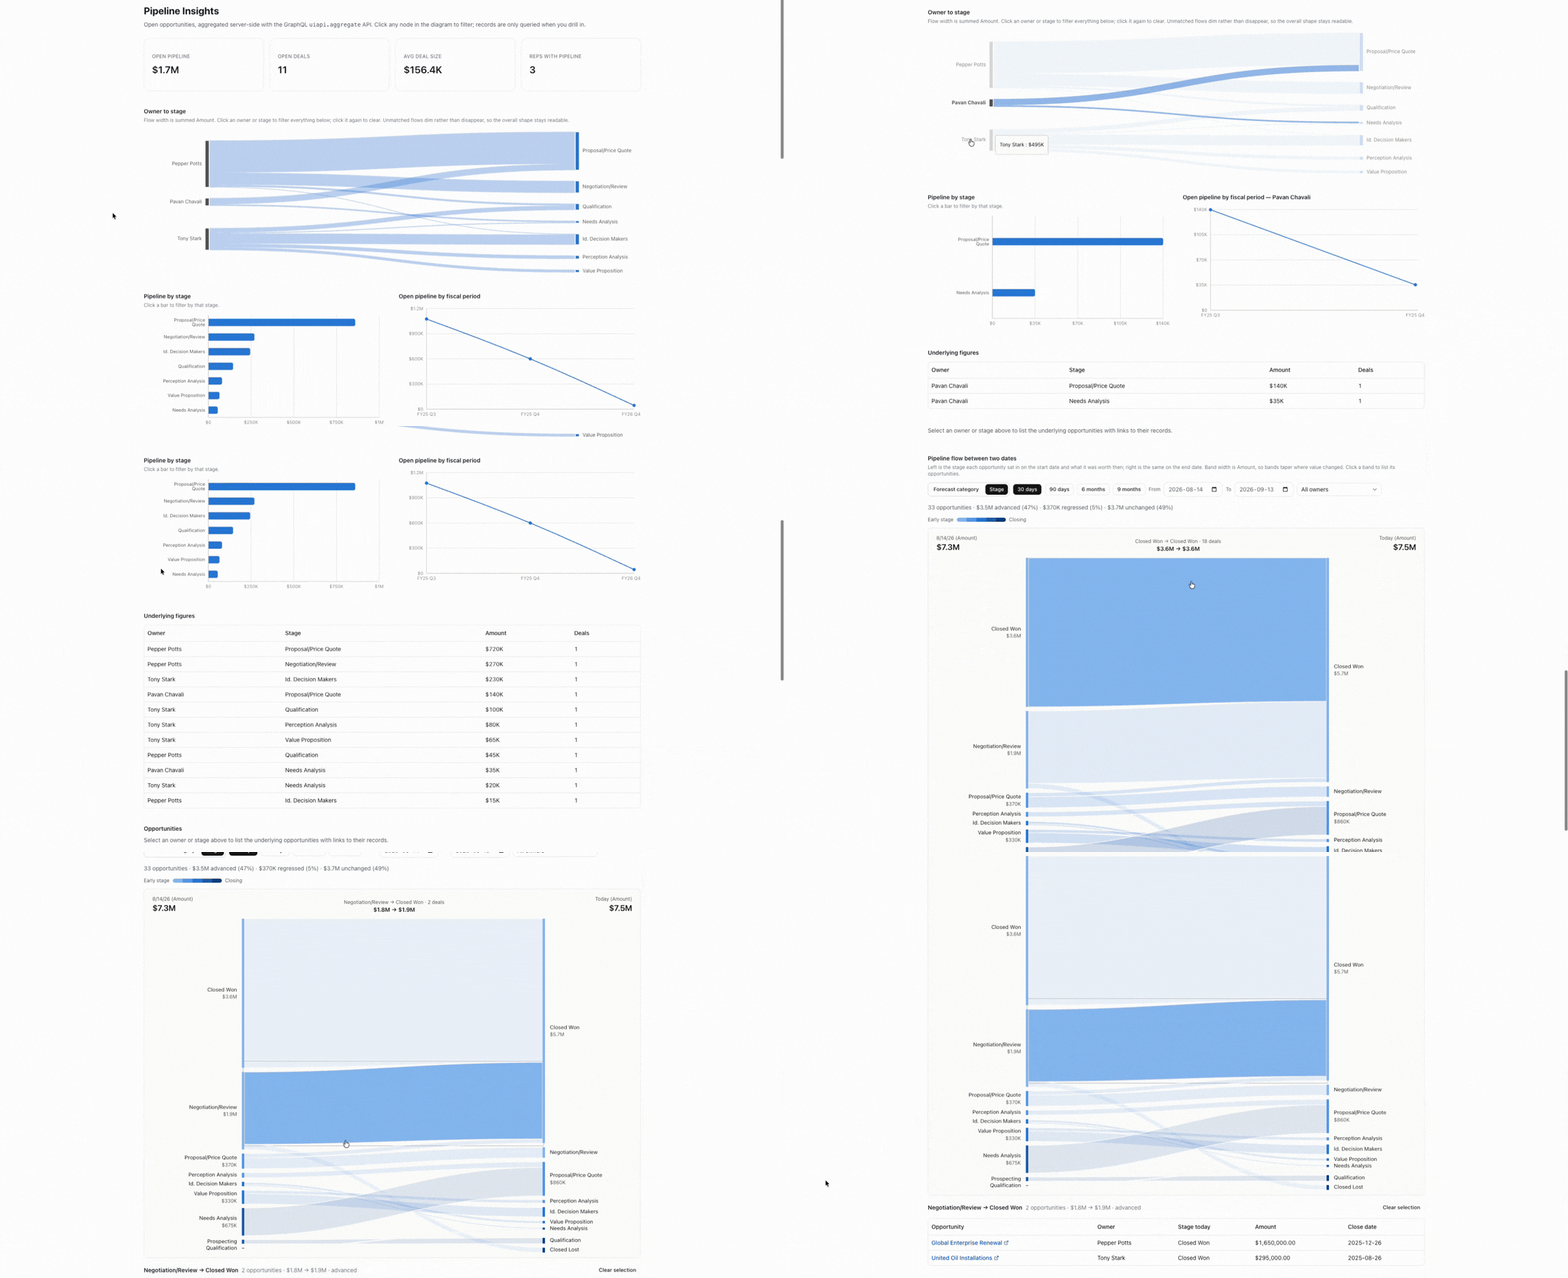
A Sankey view showing stage progression between two dates, with the dollar swing attached, isn’t an exotic ask - competitive CRM platforms bundle it into the core pipeline view. On Salesforce, the same chart lives inside Pipeline Inspector’s Flow view and per Salesforce’s documentation, Pipeline Flow chart view sits behind CRM Analytics stacked under Revenue Intelligence. Two licenses, ~$220 a seat per month, most of which buys forecasting AI and predictive risk scoring I wasn’t trying to solve for.
I wasn’t trying to replace either product. I was trying to answer a narrower question: could Salesforce’s new React runtime build that one chart natively, without stacking licenses to get there — and would what I built actually hold up past a demo?
The Question Worth Asking
Before Multi-Framework, getting a custom visualization like this natively into Salesforce meant one of two paths: pay for the whole analytics product, or build outside the platform and bolt it on with a service account and a sync job. Now there’s a third option. I wanted to know what it actually costs — in engineering time, not licensing dollars — before I recommended it to anyone.
What I Actually Built
I mirrored a fresh Developer Edition org’s metadata locally — 5,892 files, 37 MB kept as a read-only reference, never touched by anything deployable. Then I scaffolded a React UI Bundle: Vite, TypeScript, Tailwind, shadcn/ui, deployed with the same sf project deploy command I’d use for any other metadata.
The chart itself is roughly 360 lines of hand-rolled SVG. That wasn’t a flex. Recharts’ Sankey component draws a constant-width band per link — it is physically incapable of a ribbon that’s one width on the left and another on the right, and that taper is the entire point of a Pipeline Flow chart. So I dropped the library and wrote explicit bezier paths, with a surface-colored casing so adjacent ribbons separate instead of bleeding together.
⚠️ The Gotchas
The Fear: deploy succeeds, permissions check out, the app just refuses to open.
What Goes Wrong: internal React bundles serve from a separate *.my.salesforce.app domain, not your Lightning domain, routed through Salesforce Edge Network for a valid TLS certificate. Skip that and you get a browser certificate error that looks exactly like a permissions failure and has nothing to do with permissions. The deploy output won’t warn you.
The Learning: verify the App Domain is enabled before you write a line of code. <salesforceAppDomain>true</salesforceAppDomain> is one field of deployable metadata, not a Setup-only checkbox — put it in source control on day one.
The Fear: “I’ll just drop this chart onto the Opportunity record page, next to the standard fields.”
What Goes Wrong: you can’t. <target>CustomApplication</target> makes a React UI Bundle a full standalone app in the App Launcher — not a component, not a page section. This is the single biggest architectural constraint of the framework today, and it will not budge because you wanted it to.
The Learning: if the requirement is “add a chart to an existing record page,” a React UI Bundle is the wrong tool and LWC “may be the right one” plus a nod that LWC has its own gotchas for a future post. Know the requirement before you fall in love with the framework.
The Fear: everything the client can’t reach, the query layer will quietly make up for.
What Goes Wrong: it won’t. @AuraEnabled Apex and the SOQL REST endpoint are both blocked from the client — no privileged path exists to route around field-level security, so server-shaped work like “what stage was this opportunity in as of date X” has nowhere to go except paging history rows into the browser and sorting client-side. And the aggregate API that’s supposed to carry that load has its own invisible ceiling: the first parameter caps at 2000 records, codegen and TypeScript both pass queries that fail at runtime, and a 200 HTTP response doesn’t mean success — Salesforce returns 200 with a populated errors array on partial failures.
The Learning: treat the client as permanently cut off from privileged server logic, and treat every aggregate query as untrusted until you’ve run it live and read the errors array yourself. Real per-record window functions belong in Apex or a reporting snapshot — a production build isn’t purely client-side no matter how badly you want it to be.
✅ What Multi-Framework Gets Right
The GraphQL aggregate API is the real win. uiapi.aggregate.<Object>(groupBy:, where:) runs server-side GROUP BY and SUM and hands back grouped rows — not 50,000 opportunity records paged into a browser for client-side math. Every visual on the dashboard derives from two aggregate result sets, and cross-filtering the whole page costs zero extra round trips because owner and stage both live in the groupBy of those two queries.
Codegen earns its keep as a query linter, not just a generator. npm run graphql:codegen validates every query against the org’s real schema before the build runs, catching invented fields and misplaced directives at authoring time. I made it a pre-commit gate, not a suggestion.
Auth is free, genuinely free. The app runs on the existing Lightning session, inheriting the logged-in user’s permissions with none of the guest-user or community-profile configuration an external site would demand.
And the toolchain is actually modern — React 19, Vite, TypeScript, real hot module reload during development — while still shipping as ordinary, source-tracked, diffable metadata. That combination didn’t exist on this platform a year ago.
🧭 Where This Actually Fits
| Need | Right Tool |
|---|---|
| One custom visualization, full pipeline dataset, no per-seat analytics license | React UI Bundle (CustomApplication) |
| A chart or widget embedded on an existing record or app page | LWC — UI Bundles are full-page only, today |
| Forecast AI, predictive risk scoring, multiple dashboards, org-wide analytics | Revenue Intelligence or CRM Analytics |
| Heavy per-record server-side calculation at real data volume | Apex-backed LWC, or a reporting snapshot feeding the UI Bundle |
Closing Thought
I built the chart Revenue Intelligence charges ~$220 a month to see, for the cost of a weekend and licenses I already owned. That’s not an argument against buying Revenue Intelligence. It’s an argument for knowing exactly which problem you’re solving before you reach for a per-seat product to solve it.
The next time someone asks for “just one chart,” what’s actually cheaper — the platform fee, or the weekend?